
 Image 1 of 1
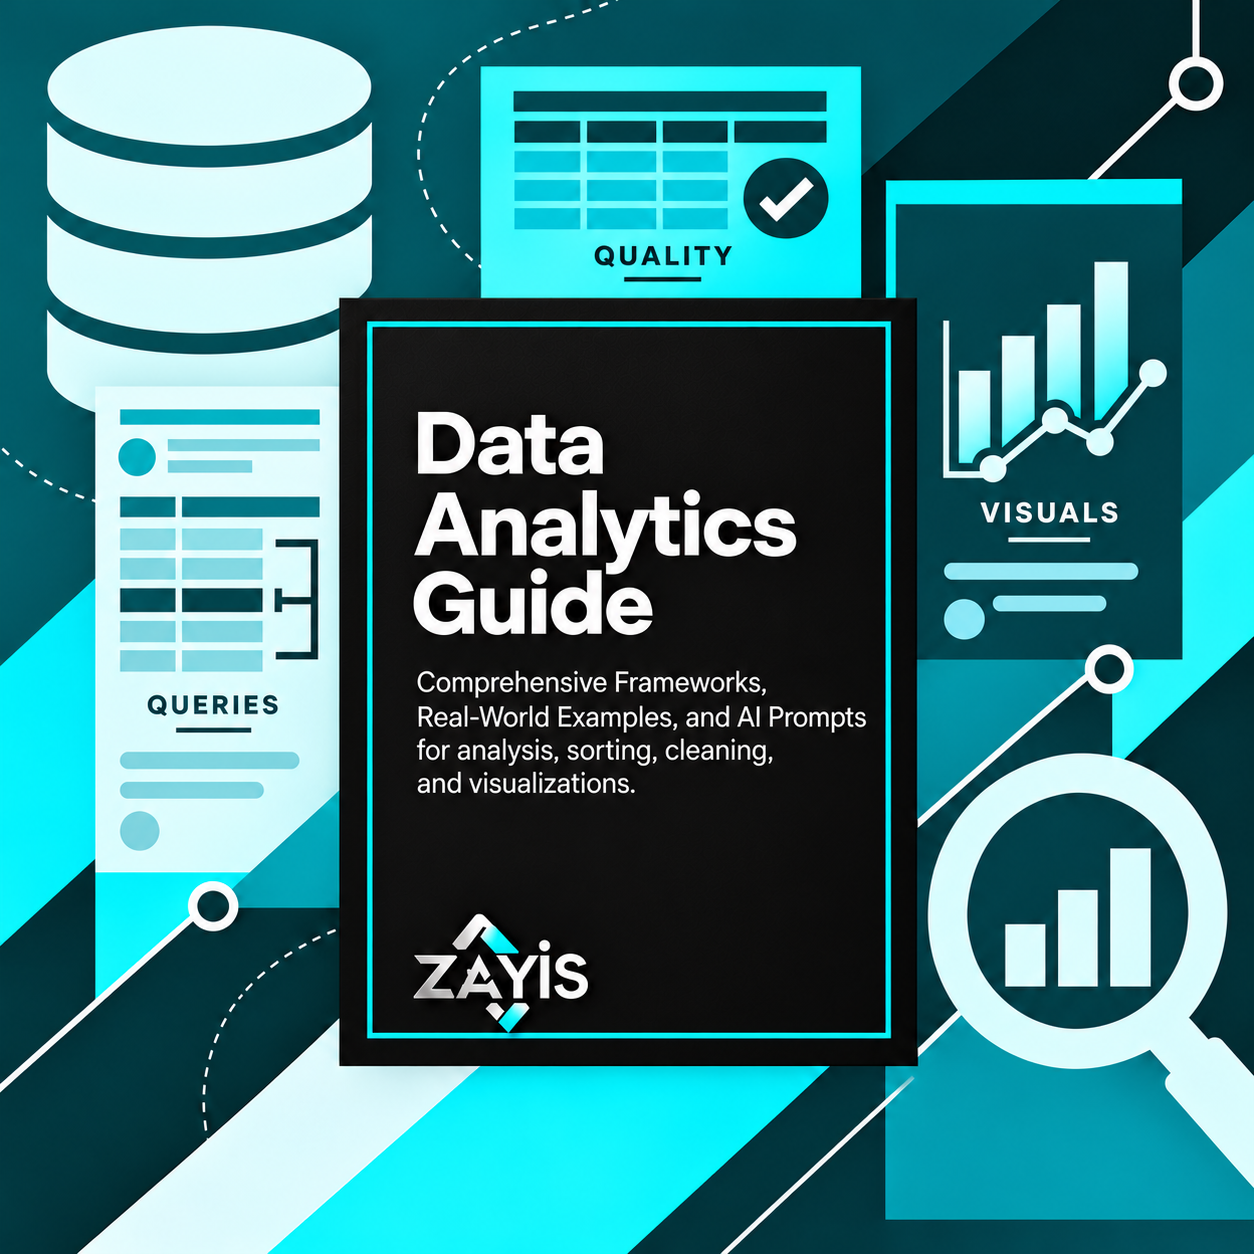
Data Analytics Guide
A dashboard full of numbers isn't the same as understanding your business. If your data can't answer a useful question, explain a problem, or support a decision, you're missing the value behind it.
You're looking at sales reports, spreadsheets, customer information, or operational metrics. But which numbers matter? Can you trust the data? What caused a change in performance? And how do you explain your findings to someone who doesn't work with data every day?
The Zayis Data Analytics Guide helps you organize those challenges. Use practical analytical frameworks and structured AI prompts to improve data preparation, investigate business questions, develop reporting plans, and communicate findings with greater clarity.
What you can build:
An executive dashboard blueprint: Define key performance indicators, reporting requirements, data sources, and visualizations that help stakeholders monitor important business outcomes.
A data cleaning and preparation workflow: Identify missing values, duplicates, inconsistent formats, and quality issues before beginning an analysis.
A SQL query optimization plan: Examine query structure, identify potential performance bottlenecks, and develop changes to test against actual database behavior.
A statistical testing and predictive modeling plan: Define hypotheses, identify relevant variables, select evaluation approaches, and document assumptions before interpreting results.
A data reconciliation framework: Investigate conflicting figures across reports, trace metric definitions, and identify possible causes of discrepancies.
A data storytelling presentation brief: Organize findings, supporting evidence, limitations, and recommended actions for business decision-makers.
An AI-assisted analysis workflow: Structure analytical tasks, define appropriate inputs, review generated calculations, and separate evidence-backed findings from unsupported conclusions.
Put your AI assistant to work with a clearer brief.
Each analytical framework provides a practical task, an illustrative example, AI prompting guidance, and implementation steps. Instead of asking AI to "analyze my data," you can define the business question, relevant metrics, data-quality concerns, and the output you need.
Upload the PDF to a compatible AI assistant, describe your analytical objective, and use approved or sanitized data to work through one task at a time. Verify calculations, SQL changes, statistical assumptions, and conclusions before relying on the results.
What's included:
A 39-page PDF with 12 data analytics frameworks.
A 90-day analytics rollout plan.
An Analysis Brief and Metric Definition Worksheet.
Frameworks covering SQL optimization, executive dashboards, statistical significance, predictive modeling, and causal analysis.
Data cleaning, visualization, reconciliation, and stakeholder communication guidance.
A responsible data-use section addressing privacy, security, and analytical integrity.
A task-based section finder, sources, and verification notes.
Who it's for: Aspiring data analysts, business owners, reporting analysts, operations managers, business intelligence professionals, and teams seeking more structured analytical processes.
Stop treating data as something you collect and report. Learn to investigate what it means, communicate what matters, and make better-informed decisions.
A dashboard full of numbers isn't the same as understanding your business. If your data can't answer a useful question, explain a problem, or support a decision, you're missing the value behind it.
You're looking at sales reports, spreadsheets, customer information, or operational metrics. But which numbers matter? Can you trust the data? What caused a change in performance? And how do you explain your findings to someone who doesn't work with data every day?
The Zayis Data Analytics Guide helps you organize those challenges. Use practical analytical frameworks and structured AI prompts to improve data preparation, investigate business questions, develop reporting plans, and communicate findings with greater clarity.
What you can build:
An executive dashboard blueprint: Define key performance indicators, reporting requirements, data sources, and visualizations that help stakeholders monitor important business outcomes.
A data cleaning and preparation workflow: Identify missing values, duplicates, inconsistent formats, and quality issues before beginning an analysis.
A SQL query optimization plan: Examine query structure, identify potential performance bottlenecks, and develop changes to test against actual database behavior.
A statistical testing and predictive modeling plan: Define hypotheses, identify relevant variables, select evaluation approaches, and document assumptions before interpreting results.
A data reconciliation framework: Investigate conflicting figures across reports, trace metric definitions, and identify possible causes of discrepancies.
A data storytelling presentation brief: Organize findings, supporting evidence, limitations, and recommended actions for business decision-makers.
An AI-assisted analysis workflow: Structure analytical tasks, define appropriate inputs, review generated calculations, and separate evidence-backed findings from unsupported conclusions.
Put your AI assistant to work with a clearer brief.
Each analytical framework provides a practical task, an illustrative example, AI prompting guidance, and implementation steps. Instead of asking AI to "analyze my data," you can define the business question, relevant metrics, data-quality concerns, and the output you need.
Upload the PDF to a compatible AI assistant, describe your analytical objective, and use approved or sanitized data to work through one task at a time. Verify calculations, SQL changes, statistical assumptions, and conclusions before relying on the results.
What's included:
A 39-page PDF with 12 data analytics frameworks.
A 90-day analytics rollout plan.
An Analysis Brief and Metric Definition Worksheet.
Frameworks covering SQL optimization, executive dashboards, statistical significance, predictive modeling, and causal analysis.
Data cleaning, visualization, reconciliation, and stakeholder communication guidance.
A responsible data-use section addressing privacy, security, and analytical integrity.
A task-based section finder, sources, and verification notes.
Who it's for: Aspiring data analysts, business owners, reporting analysts, operations managers, business intelligence professionals, and teams seeking more structured analytical processes.
Stop treating data as something you collect and report. Learn to investigate what it means, communicate what matters, and make better-informed decisions.